The numbers game
So despite the fact that The Legal Genealogist keeps saying, over and over, that the admixture percentages we see in all the autosomal DNA test results are only good for cocktail party conversation, the fact is, hey, at this time of year there are a lot of cocktail parties.
And, of course, a lot of admixture tools. One of ’em just got updated, and I couldn’t resist taking a look.
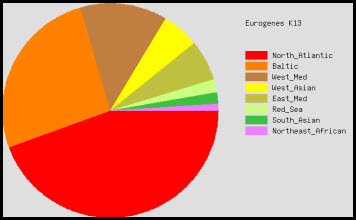 The tool is the Eurogenes K13 admixture tool; it’s accessed through my favorite third-party utility site, Gedmatch.
You head over to the site, log in, choose Admixture from the Analyze Your Data options, select Eurogenes from the drop-down menu and “Admixture Proportions (with link to Oracle)” from the radio button choices, and then click on continue.
Enter your kit number at the top, select Eurogenes K13 from the drop down list for calculator models and click continue again.
And then you wait while it runs through 1000 iterations comparing your raw data to the data in its population samples using its algorithms.
The first thing I wanted to see was how my mother’s two brothers and one sister whose kits we have at Gedmatch compare to each other. It was intriguing to see how their results are close — but not exactly the same.
| Uncle 1 | Uncle 2 | Aunt | |
| 1 | North Atlantic 48.58 | North Atlantic 46.72 | North Atlantic 48.03 |
|---|---|---|---|
| 2 | Baltic 23.33 | Baltic 23.11 | Baltic 25.31 |
| 3 | West Med 13.43 | West Med 13.22 | West Med 12.63 |
| 4 | West Asian 6.75 | East Med 6.83 | East Med 5.1 |
| 5 | East Med 4.27 | West Asian 5.7 | West Asian 4.94 |
| 6 | Red Sea 1.33 | South Asian 2.18 | Red Sea 1.23 |
| 7 | Northeast African 0.98 | Northeast African 0.99 | South Asian 1.06 |
| 8 | East Asian 0.47 | Red Sea 0.74 | Oceanian 0.52 |
| 9 | South Asian 0.44 | Sub-Saharan 0.32 | East Asian 0.5 |
| 10 | Oceanian 0.34 | Oceanian 0.18 | Northeast African 0.41 |
You can see from that table that the top five general areas that make up the admixture of all three are the same — but not in the same order and not in exactly the same percentages. (And, by the way, everything under one percent is pretty much just noise.)
Then we can match them up against the specific sample populations used by this tool to see which modern populations they’re most like. And, again, they’re close but not exactly the same:
| Uncle 1 | Uncle 2 | Aunt | |
| 1 | Southeast English 3.28 | German 3.54 | Dutch 2.34 |
|---|---|---|---|
| 2 | Dutch 3.46 | Southeast English 4.23 | German 3.29 |
| 3 | Orcadian 3.99 | Dutch 4.86 | Southeast English 3.41 |
| 4 | German 4.16 | Danish 5.66 | Danish 3.7 |
| 5 | Southwest English 4.19 | Orcadian 6.01 | Orcadian 4.09 |
| 6 | Danish 4.22 | Southwest English 6.3 | Irish 5.26 |
| 7 | Irish 4.48 | Irish 6.99 | Southwest English 5.41 |
| 8 | West Scottish 5.04 | West Scottish 7.36 | West Scottish 5.77 |
| 9 | Norwegian 7.53 | Norwegian 8.82 | Norwegian 6.19 |
| 10 | Swedish 8.52 | French 9.23 | Swedish 6.94 |
Then I wanted to look at a more personal comparison. The comparison between me, 50% German and 50% colonial American mutt, and my half-brother, 50% German and 50% Swedish (all four of our father’s grandparents were born in Germany and all four of his mother’s grandparents were born in Sweden).
I wanted to see how well this particular tool discerns the German and the Scandinavian in that sort of mix since all of my German results disappeared in the most recent AncestryDNA admixture analysis, And here’s what we got:
| Half-sister (me) | Half-brother | |
| 1 | North Atlantic 44.55 | North Atlantic 47.3 |
|---|---|---|
| 2 | Baltic 26.14 | Baltic 30.8 |
| 3 | West Med 12.93 | West Med 8.67 |
| 4 | East Med 6.22 | West Asian 6.29 |
| 5 | West Asian 5.48 | East Med 3.81 |
| 6 | Red Sea 1.84 | South Asian 1.27 |
| 7 | South Asian 1.62 | Red Sea 0.89 |
| 8 | Northeast African 0.95 | Amerindian 0.84 |
| 9 | Amerindian 0.27 | Oceanian 0.07 |
| 10 | — | Sub-Saharan 0.07 |
Those are the overall numbers — now for the populations:
| Half-sister (me) | Half-brother | |
| 1 | German 2.23 | Swedish 3.02 |
|---|---|---|
| 2 | Dutch 4.46 | Norwegian 4.14 |
| 3 | Southeast English 6.35 | Dutch 5.51 |
| 4 | Danish 6.8 | German 6.26 |
| 5 | Orcadian 7.23 | Danish 6.88 |
| 6 | Norwegian 7.91 | North Swedish 7.44 |
| 7 | Swedish 8.04 | Orcadian 7.83 |
| 8 | Irish 8.26 | Irish 8.37 |
| 9 | Southwest English 8.35 | Southeast English 8.95 |
| 10 | West Scottish 8.94 | West Scottish 9.18 |
So… this admixture tool spots our German (which appears to look a lot like Dutch), and spots my brother’s Swedish (which appears to look a lot like Norwegian).
There are two things I find interesting about this tool, since we’re chatting now over our cocktails.
The first thing is that, unlike the recent change in the analysis by AncestryDNA (see DNA disappointment, posted 15 September 2013), this admixture calculator doesn’t seem to have any trouble finding the Germans. I get ’em, my brother gets ’em, even my mother’s siblings get ’em (and that makes sense — we have a Shew line that I expect goes back to some German Schuhs).
And the other thing is how very alike these reference populations must be for the results to be coming out the way they are. German and Dutch and Danish all so very close, Southeastern and Southwestern English and Irish and Orcadian.
I still want a magic wand I can wave that would put an ethnic and geographic origin stamp on every segment of my DNA. For that matter, I want a magic wand that will mark each segment with the name of the specific ancestor I inherited it from — maiden names of women included.
But in the interim, it’s really fascinating — here around the Sunday cocktail table — to see that we’re really not French or German or Dutch or Danish.
We’re simply human.
And so much more alike than we are different.


Judy
Agreed that admixture analysis is far from settled! My results:
FTDNA FF – 94% from the Pyrenees region, both sides, plus the Orkneys (which apparently were settled by Iberians after the ice melted last time); 6% Tuscan/Sardinian
23andMe – 100% European, not much definition after that; not very useful
Eurogenes K13:
– 48% North Atlantic
– 23% Baltic
– 13% West Med
– 8% East Med
– 5% West Asian
Oracle Single Population Sharing:
– Southeast English, German; then
– Dutch, Danish, Orcadian, Southwest English; then
– Irish, West Scottish; then deeper down
– Dash of Hungarian
– followed by a whole collection of Iberian and Southwest French (Pyrenees again)
My known ancestry is English, German, Irish, and Scottish, and there may be a Frenchman back there somewhere. DNA points to the Pyrenees (mtDNA V). I wonder if FTDNA is trying to tell me that all of my ancestors came out of the Iberian refuge and spread up the west coast of Europe?
Regards
John
Stuttgart
Fascinating numbers. I am Dutch going back 10 generations, and so is my mom. We both tested and in both our cases, German is the nr. 1 reference population, with Dutch a close second. I think there’s not much difference between Dutch and German, genetically speaking.
What I find hilarious is that my father’s phased kit (he hasn’t tested) comes up 3% Amerindian (I’m at 1.5%). I’ve been able to trace 10 generations of his ancestors on all lines except 2 or 3 people, and they all come from within 10 miles of the house where he was born, in a village on the Dutch/German border. Definitely no Indians there! I’m sharing this because a lot of Americans get excited when they see 3% Native American and think this cannot be a statistical anomaly. But believe me, if my father can show up 3% native, it can definitely be a fluke.
I suspect that Dutch and German (and probably Danish as well) will prove to be just about indistinguishable in the long run, Yvette. Now as for that Native American — some interesting recent developments suggest that the even more ancient ancestors of our Native Americans may have “fed” their DNA to Europe as well as the New World. We have more to learn there too!
The Native-American ancestry in Europe most likely came from the Sami. Strange that most people forget about them.
Agree. The forgotten race. 🙁
Um, Baltic?
Mine are fairly close to the aunts & uncles. Interestingly, my West_Med is identical to our Aunt’s.
And man… the mixed mode really wants to give you an explanation for that odd Middle East thing we keep seeing!
I’m confused by the Single Population / Distance figures. What does “distance” refer to?
It’s a measure of the differentiation between you and the reference populations. The higher the number, the more different you are.
Hello
So whats the hightest a person can get till you should ignore it? I’m sorry I’m really new at this, and I’m tryin to find out whats in my dna.
Does this also go for the Mixed mode pop?
Ex.
Mixed Mode Population Sharing:
#
Primary Population (source)
Secondary Population (source)
Distance
1
86.9%
Spanish_Castilla_Y_Leon + 13.1% Algerian_Jewish @2.16
88.6%Spanish_Castilla_Y_Leon+ 11.4%Tunisian_Jewish @2.28
88.4%Spanish_Castilla_Y_Leon+ 11.6%Tunisian@ 2.35
91.2%Spanish_Castilla_Y_Leon+ 8.8%Egyptian@ 2.39
There’s no realistic way to answer this question, since it’s so heavily dependent on the quality of the reference population and the reliability of the data.
Please define the area included in “ATLANTIC”, being as specific as you can. Thanks!
Every admixture tool has a different definition of the areas included in a specific reference population — and the definition may change over time as the reference populations vary over time. You’d need to look at the description for each one as it is now.
You are aware that this – like any other lineage DNA – uses your mother’s / father’s mother’s DNA only.
The X gene.
So men get the X from their mother
Women get the X from their mother and from their father’s mother
Given that your relatives either all came from the same country given their closeness and/or even the same village / region. I wouldn’t be surprised if they married cousins throughout your bloodline.
The venerable NPR posted a story about this very topic today (of course agreeing with what Judy has already said):
http://www.npr.org/sections/13.7/2016/02/12/466379200/can-you-tell-your-ethnic-identity-from-your-dna?
Hello Judy, here is my results from the new v2 k15 test. now that I see German and Dutch are close along with Orkny and Ireland being related and my Welsh relations must be south England. My question is, am I all of these groups or is this just a list of people who I most closely relate to. most of them make sense based on my genealogy. As I understand it 1 is a good match and past 10 it looks fuzzy. thanks brian
# Population (source) Distance
1 West_German 4.22
2 Southwest_English 6.24
3 South_Dutch 6.24
4 Southeast_English 6.92
5 North_German 7.25
6 North_Dutch 7.26
7 Danish 7.87
8 Orcadian 8.28
9 Irish 8.36
10 West_Scottish 8.65
11 French 8.88
12 Norwegian 9.51
13 West_Norwegian 10.33
14 Swedish 10.37
15 East_German 12.09
16 North_Swedish 13.14
17 Hungarian 15.42
18 Austrian 15.75
19 Spanish_Galicia 16.77
20 Spanish_Cataluna 17.04
For a full explanation of that admixture tool, you need to ask its author, and the links are there are the admixture tool to find the blog.
Can anyone help me to interpret my results somewhat? I have asked around and haven’t gotten much of a response. I know my maternal side only, and with 100 percent certainty I am 25% Irish and 25% Italian. Ancestry predicted that correctly for me, but also said I had 22% Great Britain and 15% Eastern Europe which would be from my birth father who I know little about. What would the Mediterranean groups be? Do you think that these results reflect British or E. Europe in any way?
# Population Percent
1 North_Atlantic 34.25
2 Baltic 21.65
3 West_Med 17.22
4 East_Med 12.28
5 West_Asian 11.14
6 Red_Sea 1.76
7 East_Asian 1.30
Those groups are much more likely to represent the Italian part of your ancestry.
I have Shews in my family tree also. 🙂 By North Atlantic, do you know what countries are included in that outcome?
What branch of the Shew family are you from? For an overview of K13 Eurogenes, see this blog post.
ancestry gave my dna results as 63% british?27% irish and 7% scandinavian,on gedmatch my single population share came as irish 3.11,southwest english 3.41,west scots,3.42,orcadian,3.69 south east english 3.92 dutch 5.25 danish 5.71 north german7.04.all my ancestors on most sides come from england ,why the high irish score?i must admit i dont understand it.
Please read all the posts on admixture for a better understanding — these percentages are ESTIMATES ONLY and are only truly reliable at the continental level (Europe versus Asia versus Africa, for example).
thank you for your reply,your photographs are lovely,wish i was there,enjoy your holiday.kind regards carol heaps.
My father is a Croatian; My mom’s mother German and father Russian (maybe Jewish). But I got this on Eurogenes K13 4-Ancestors Oracle:
Using 3 populations approximation:
1 50% Bulgarian +25% North_Swedish +25% Southwest_Russian @ 3.300982
Using 4 populations approximation:
+++++++++++++++++++++++++++++++++++++++++++++++++++++++++++++++++++++++++++++++++++++
1 Ashkenazi + Southeast_English + Southwest_Russian + Southwest_Russian @ 2.796521
2 Ashkenazi + Orcadian + Southwest_Russian + Southwest_Russian @ 2.913020
3 Ashkenazi + Norwegian + Southwest_Russian + Ukrainian @ 2.931123
4 Ashkenazi + Southeast_English + Southwest_Russian + Ukrainian_Belgorod @ 2.934420
5 Ashkenazi + Belorussian + Southeast_English + Southwest_Russian @ 2.959644
6 Ashkenazi + South_Polish + Southwest_Russian + Swedish @ 2.969008
7 Ashkenazi + Estonian + Southwest_Russian + West_German @ 2.972332
8 Ashkenazi + North_Dutch + Southwest_Russian + Southwest_Russian @ 2.982825
9 Ashkenazi + Belorussian + Southeast_English + Ukrainian_Belgorod @ 2.996371
10 Ashkenazi + Danish + Southwest_Russian + Ukrainian @ 3.010063
11 Ashkenazi + Estonian_Polish + Southeast_English + Southwest_Russian @ 3.015199
12 Ashkenazi + Hungarian + South_Polish + Southwest_Finnish @ 3.024596
13 Ashkenazi + Estonian + Ukrainian_Belgorod + West_German @ 3.025175
14 Ashkenazi + Danish + Southwest_Russian + Southwest_Russian @ 3.030258
15 Ashkenazi + Norwegian + South_Polish + Southwest_Russian @ 3.035321
16 Ashkenazi + North_Dutch + Southwest_Russian + Ukrainian @ 3.042224
17 Ashkenazi + North_Swedish + South_Polish + South_Polish @ 3.044177
18 Belorussian + Hungarian + South_Italian + Southwest_Finnish @ 3.048157
19 Ashkenazi + Estonian_Polish + Southeast_English + Ukrainian_Belgorod @ 3.059220
20 Belorussian + Bulgarian + Bulgarian + North_Swedish @ 3.068309
Why does Ashkenazi show so consistently? Does that mean it is dominant? Thank you for the clarification.
For an explanation of the way Eurogenes calculates things, you need to ask the author. As noted at GedMatch: “This utility uses the Eurogenes K13 model (rev 21 Nov 2013), created by Davidski (Polako). Questions and comments about this model should be directed to him at his Project Blog.“
Thank you, Judy, for your response. I did contact him but have not received a response (yet).